
Quick Answer
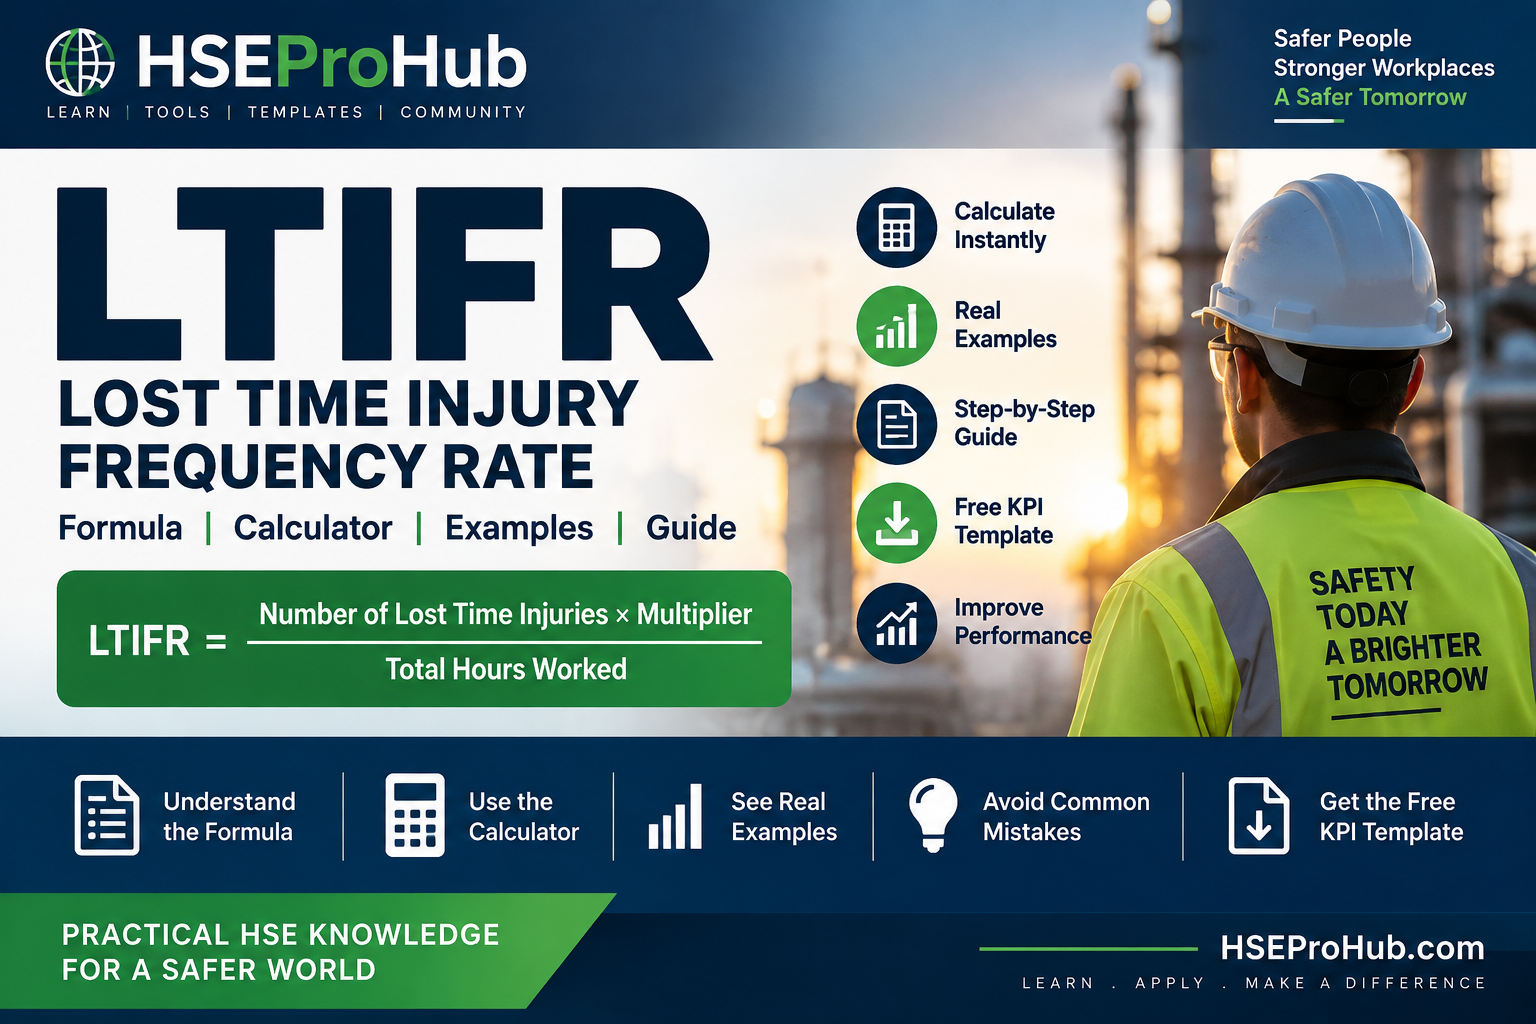
LTIFR = (Number of Lost Time Injuries × Reporting Multiplier) ÷ Total Hours Worked
A commonly used reporting basis is 1,000,000 hours, although other normalization factors are also used. Always confirm the reporting convention required by your organization, client, regulator or applicable standard.
What Is LTIFR?
LTIFR stands for Lost Time Injury Frequency Rate.
It is a lagging HSE performance indicator used to express the frequency of lost-time injuries relative to the number of hours worked during a defined reporting period.
Simply counting injuries does not account for differences in workforce size or exposure.
For example, one lost-time injury during 100,000 working hours represents a different frequency of occurrence from one lost-time injury during 5 million working hours.
LTIFR helps normalize this information so that safety performance can be monitored over time.
It may be used for:
- Monthly HSE performance reporting
- Project dashboards
- Contractor performance monitoring
- Management reviews
- Client reporting
- Trend analysis
- Corporate HSE statistics
- Benchmarking, where definitions and reporting bases are comparable
However, LTIFR should never be interpreted in isolation. It is a lagging indicator describing an outcome that has already occurred.
LTIFR Formula
The general formula is:
LTIFR = (Number of Lost Time Injuries × Multiplier) ÷ Total Hours Worked
Where:
Number of Lost Time Injuries = qualifying LTIs recorded during the reporting period.
Total Hours Worked = applicable exposure hours for the same reporting period and population.
Multiplier = normalization factor required by the applicable reporting methodology.
If the organization uses a 1,000,000-hour basis, the formula becomes:
LTIFR = (LTI × 1,000,000) ÷ Total Hours Worked
Free LTIFR Calculator
You don’t need to calculate it manually.
Use the HSEProHub calculator to enter your:
- Lost Time Injuries
- Total Hours Worked
- Reporting multiplier
- Reporting period
The calculator will automatically display the LTIFR and complete calculation.
Calculate Your LTIFR →
LTIFR Calculation Example
Assume a project has recorded:
| Parameter | Value |
|---|---|
| Lost Time Injuries | 2 |
| Hours Worked | 4,000,000 |
| Reporting Multiplier | 1,000,000 |
Apply the formula:
LTIFR = (2 × 1,000,000) ÷ 4,000,000
Therefore:
LTIFR = 0.50
The project therefore recorded an LTIFR of:
0.50 lost-time injuries per 1,000,000 hours worked
for the reporting period and scope used in the calculation.
Why Do We Use a Multiplier?
The multiplier normalizes the result.
Without normalization, comparing organizations, projects or periods with substantially different exposure hours would be difficult.
Consider two projects.
Project A
Lost Time Injuries: 1
Hours Worked: 500,000
Using a 1,000,000-hour basis:
LTIFR = 1 × 1,000,000 ÷ 500,000
LTIFR = 2.00
Project B
Lost Time Injuries: 1
Hours Worked: 2,000,000
LTIFR = 1 × 1,000,000 ÷ 2,000,000
LTIFR = 0.50
Both projects recorded exactly one LTI, but their exposure hours were substantially different.
That is why frequency rates can provide more context than incident counts alone.
LTIFR Calculation Examples
| LTI | Hours Worked | Multiplier | LTIFR |
|---|---|---|---|
| 0 | 1,000,000 | 1,000,000 | 0.00 |
| 1 | 500,000 | 1,000,000 | 2.00 |
| 1 | 1,000,000 | 1,000,000 | 1.00 |
| 1 | 2,000,000 | 1,000,000 | 0.50 |
| 2 | 4,000,000 | 1,000,000 | 0.50 |
| 3 | 5,000,000 | 1,000,000 | 0.60 |
Try your own data using the:
Free HSEProHub LTIFR Calculator →
1,000,000 Hours vs 200,000 Hours
This is one of the most important considerations when interpreting occupational safety rates.
Different reporting systems can use different normalization factors.
For example:
1,000,000 hours
and
200,000 hours
are both encountered in occupational safety reporting.
Consider:
1 LTI
1,000,000 hours worked
Using a 1,000,000 multiplier:
1 × 1,000,000 ÷ 1,000,000 = 1.00
Using a 200,000 multiplier:
1 × 200,000 ÷ 1,000,000 = 0.20
Nothing about the underlying incident performance changed.
Only the normalization factor changed.
Therefore:
Never compare two frequency rates without first checking:
- Definition of the numerator
- Reporting period
- Workforce population
- Exposure-hour calculation
- Reporting multiplier
A professional HSE report should preferably state the basis explicitly.
Instead of:
LTIFR = 0.50
use:
LTIFR = 0.50 per 1,000,000 hours worked
This provides considerably more context.
What Is Considered a Lost Time Injury?
This requires care.
A Lost Time Injury (LTI) generally involves a work-related injury or illness resulting in the affected person being unable to perform normal work for a defined period following the event.
However, the precise definition can vary between reporting frameworks.
HSE professionals should therefore use the classification established by the applicable:
- Legislation
- Regulatory framework
- Client requirement
- Contract
- Corporate HSE procedure
- Project HSE plan
- Reporting standard
Avoid creating a new definition simply for calculating the KPI.
Consistency is essential.
What Hours Should Be Included?
The denominator should represent the applicable exposure hours for the population covered by the incident statistics.
Depending on the organization’s methodology, this could include:
- Employees
- Direct workers
- Contractors
- Subcontractors
- Temporary workers
- Other covered personnel
The numerator and denominator should represent a consistent population.
For example, if contractor LTIs are included in the numerator while the corresponding contractor working hours are excluded from the denominator, the resulting frequency rate may be misleading.
Monthly LTIFR
Monthly LTIFR uses incidents and hours for an individual month.
Monthly LTIFR = Monthly LTI × Multiplier ÷ Monthly Hours Worked
Monthly rates can fluctuate significantly, particularly where exposure hours are relatively low.
For example, one LTI occurring during a low-hour month can cause a large temporary increase in the rate.
Therefore, monthly LTIFR should normally be interpreted together with longer-term trends.
Year-to-Date LTIFR
Year-to-Date or YTD LTIFR uses cumulative information from the beginning of the reporting year.
YTD LTIFR = YTD LTI × Multiplier ÷ YTD Hours Worked
This can provide a more stable view than an individual monthly result.
Rolling 12-Month LTIFR
Another useful approach is a rolling 12-month rate.
Rolling 12M LTIFR = LTIs during the previous 12 months × Multiplier ÷ Hours worked during the previous 12 months
Every month, the calculation window moves forward.
For example:
September 2026 reporting could consider:
October 2025 – September 2026
and October 2026 would then consider:
November 2025 – October 2026
This reduces some of the volatility associated with isolated monthly rates.
Can LTIFR Be Zero?
Yes.
If there are no qualifying LTIs during the reporting period:
LTI = 0
Therefore:
LTIFR = 0
For example:
0 × 1,000,000 ÷ 3,000,000 = 0.00
An organization may therefore report:
3 Million Hours Without a Lost Time Injury
and have an LTIFR of 0.00 for the relevant reporting scope.
However, this requires an important qualification.
Does Zero LTIFR Mean the Workplace Is Safe?
Not necessarily.
LTIFR measures a particular type of historical outcome.
It does not directly measure whether today’s critical risks are adequately controlled.
An organization could have zero LTIs while still having weaknesses involving:
- Work at height
- Lifting operations
- Electrical isolation
- Vehicle movements
- Excavation
- Confined spaces
- Process safety
- Temporary electrical systems
- Equipment integrity
Therefore, LTIFR should be considered alongside leading indicators and critical-control performance.
LTIFR Is a Lagging Indicator
Lagging indicators measure events or consequences that have already occurred.
Examples include:
- Fatalities
- Lost Time Injuries
- Recordable injuries
- Lost days
- Severity Rate
- Environmental incidents
Leading indicators focus more on preventive activity and control effectiveness.
Examples could include:
- Critical-control verification
- Safety inspections
- Hazard reporting
- Corrective-action closure
- PTW compliance
- Training competency
- Preventive maintenance
- Leadership engagements
- Audit findings
- Emergency drills
A mature HSE dashboard should normally contain both leading and lagging indicators.
LTIFR vs TRIR
LTIFR and TRIR are related safety metrics, but they should not be treated as interchangeable.
LTIFR
Focuses specifically on qualifying Lost Time Injuries.
TRIR
TRIR generally refers to a broader group of recordable occupational injury and illness cases under the reporting methodology being applied.
The formulas may also use different multipliers.
Therefore, comparing an LTIFR directly with a TRIR without understanding the underlying methodology can be misleading.
HSEProHub will cover this separately in:
TRIR Calculator & Complete Guide
LTIFR vs Severity Rate
LTIFR measures frequency.
Severity Rate considers consequence, typically through lost days relative to exposure.
Consider two organizations.
Organization A
1 LTI resulting in 2 lost days.
Organization B
1 LTI resulting in 150 lost days.
If their exposure hours are identical, they may have the same LTIFR.
But the consequences of the events are clearly different.
This is why frequency and severity indicators are often considered together.
Common LTIFR Calculation Mistakes
1. Using the wrong multiplier
Don’t automatically assume the calculation uses 1,000,000 hours.
Verify the reporting requirement.
2. Mixing reporting periods
The injury count and exposure hours must cover the same period.
Do not divide annual incidents by monthly working hours.
3. Inconsistent workforce scope
If subcontractor incidents are included, ensure corresponding exposure-hour treatment follows the same reporting methodology.
4. Incorrect incident classification
Not every injury is automatically an LTI.
Apply the established incident-classification requirements.
5. Comparing incompatible rates
A rate calculated per 200,000 hours should not be directly compared with a rate calculated per 1,000,000 hours without understanding or converting the reporting basis.
6. Ignoring exposure hours
Saying:
“Project A had two injuries while Project B had one.”
doesn’t provide enough information to compare frequency.
Exposure must also be considered.
7. Treating LTIFR as the entire HSE performance measure
A low LTIFR does not automatically demonstrate strong management of high-consequence hazards.
Use a balanced set of indicators.
How to Present LTIFR on an HSE Dashboard
Instead of displaying LTIFR alone, consider presenting:
| Indicator | Current | Target | Trend |
|---|---|---|---|
| Lost Time Injuries | 0 | 0 | → |
| LTIFR | 0.00 | 0.00 | ↓ |
| Hours Worked | 3,250,000 | — | ↑ |
| TRIR | 0.18 | Project Target | ↓ |
| Severity Rate | 0.00 | Project Target | → |
| Near Misses | 12 | ≥ Target | ↑ |
You could additionally display:
- Current month
- Previous month
- Year-to-date
- Rolling 12 months
- Target
- Trend
- Total exposure hours
This provides management with significantly more useful information than a standalone LTIFR number.
Free HSE KPI Dashboard Template
Knowing the formula is useful.
Managing the trend is more valuable.
HSEProHub has created a free Excel-based HSE KPI Dashboard Template to help professionals monitor key safety indicators.
The template includes:
Dashboard
- Total Hours Worked
- Lost Time Injuries
- LTIFR
- TRIR
- 12-month trend chart
Monthly Data
Track:
- Hours worked
- LTIs
- Recordable cases
- Lost days
- Fatalities
- Near misses
- LTIFR
- TRIR
- Severity Rate
- Targets
KPI Definitions
Includes formula/basis guidance for:
- LTIFR
- TRIR
- Severity Rate
- Fatalities
- Near Miss reporting
Instructions
Guidance is included directly in the workbook.
Download the Free HSE KPI Dashboard
FREE EXCEL TEMPLATE
Track your monthly HSE statistics and automatically calculate key performance indicators.
The calculator page contains the actual Excel download.
How Can an Organization Improve LTIFR?
The objective should not simply be to make the number smaller.
The objective is to prevent the incidents represented by the number.
That requires attention to areas such as:
Hazard Identification
Identify hazards before exposure occurs.
Risk Assessment
Assess the likelihood and potential consequences of hazardous activities.
Critical Controls
Identify and verify controls preventing fatal and serious events.
Permit to Work
Ensure high-risk activities are properly authorized and controlled.
Competency
Workers and supervisors must be competent for the activities they perform.
Supervision
Controls should be implemented and verified at the workfront.
Equipment Integrity
Vehicles, lifting equipment, machinery and safety systems must remain fit for purpose.
Contractor Management
Contractor performance should be integrated into the overall HSE management system.
Incident Learning
Investigations should identify underlying causes and produce effective corrective actions.
Management of Change
Changes in equipment, workforce, methods or conditions should be assessed before implementation.
Leadership
Management visibility and accountability strongly influence how HSE systems operate in practice.
LTIFR Reporting Checklist
Before publishing your LTIFR, confirm:
- LTI classification has been verified.
- Hours worked cover the correct population.
- Incident and hour periods are identical.
- Contractor scope is consistent.
- Correct multiplier has been used.
- Reporting basis is stated.
- Calculation has been independently checked.
- Target uses a comparable reporting basis.
- Previous-period comparison is valid.
- LTIFR is considered alongside other HSE indicators.
Frequently Asked Questions
What does LTIFR stand for?
LTIFR stands for Lost Time Injury Frequency Rate.
What is the formula for LTIFR?
The general formula is:
LTIFR = Number of Lost Time Injuries × Reporting Multiplier ÷ Total Hours Worked
The multiplier depends on the reporting methodology being used.
Is LTIFR calculated per 1 million hours?
A 1,000,000-hour multiplier is commonly used in some industries and jurisdictions, but it is not the only reporting basis.
Always verify the required methodology.
Can LTIFR use 200,000 hours?
A 200,000-hour normalization factor is used in some occupational safety rate methodologies.
The multiplier must therefore be clearly stated when communicating or comparing results.
What is a good LTIFR?
There is no single LTIFR value that should automatically be considered “good” for every organization.
Industry, workforce exposure, reporting definitions, jurisdiction, organizational requirements and the normalization factor can differ.
Performance should be assessed against comparable data and the applicable organizational/client requirements, while also considering other leading and lagging indicators.
Is zero LTIFR good?
Zero LTIFR means that no qualifying lost-time injuries were included in the relevant calculation period and scope.
That is a positive outcome, but it does not by itself demonstrate that every significant workplace risk is effectively controlled.
What is the difference between LTIFR and LTI?
LTI is a count/classification of Lost Time Injuries.
LTIFR relates that count to exposure hours.
Should contractor hours be included?
That depends on the reporting methodology and population being measured.
The important principle is consistency between the incidents included in the numerator and the exposure represented by the denominator.
Key Takeaways
Remember these five points:
1. LTIFR measures the frequency of lost-time injuries relative to exposure hours.
2. Formula: LTI × multiplier ÷ hours worked.
3. Always state the reporting multiplier.
4. Keep workforce scope and reporting periods consistent.
5. Never use LTIFR as the only measure of HSE performance.
LTIFR becomes much more useful when it forms part of a balanced HSE performance-management system incorporating frequency, severity, leading indicators, critical-control verification and trend analysis.
Put Your HSE Data to Work
Don’t stop at calculating one number.
Calculate
Use the HSEProHub LTIFR Calculator for instant results and worked calculations.
Download
Use our Free HSE KPI Dashboard Template to monitor your monthly performance.